

Your CSAT dashboard is lying to you: we analyzed 9.4 million customer conversations to find out why
This article is part of The Conversation Lab, where we publish short data stories from customer conversations. We analyze interaction patterns across our customer base and share what we find with CX leaders who need stronger signals than sampled QA and survey responses alone.
Nearly every contact center leader we've spoken to has had the sneaking suspicion at some point: the CSAT score on the dashboard doesn't quite match what's happening in the real world. Complaints are up, escalations are up, but the number holds. Something is off, but survey data isn't the kind of thing you can go back and audit.
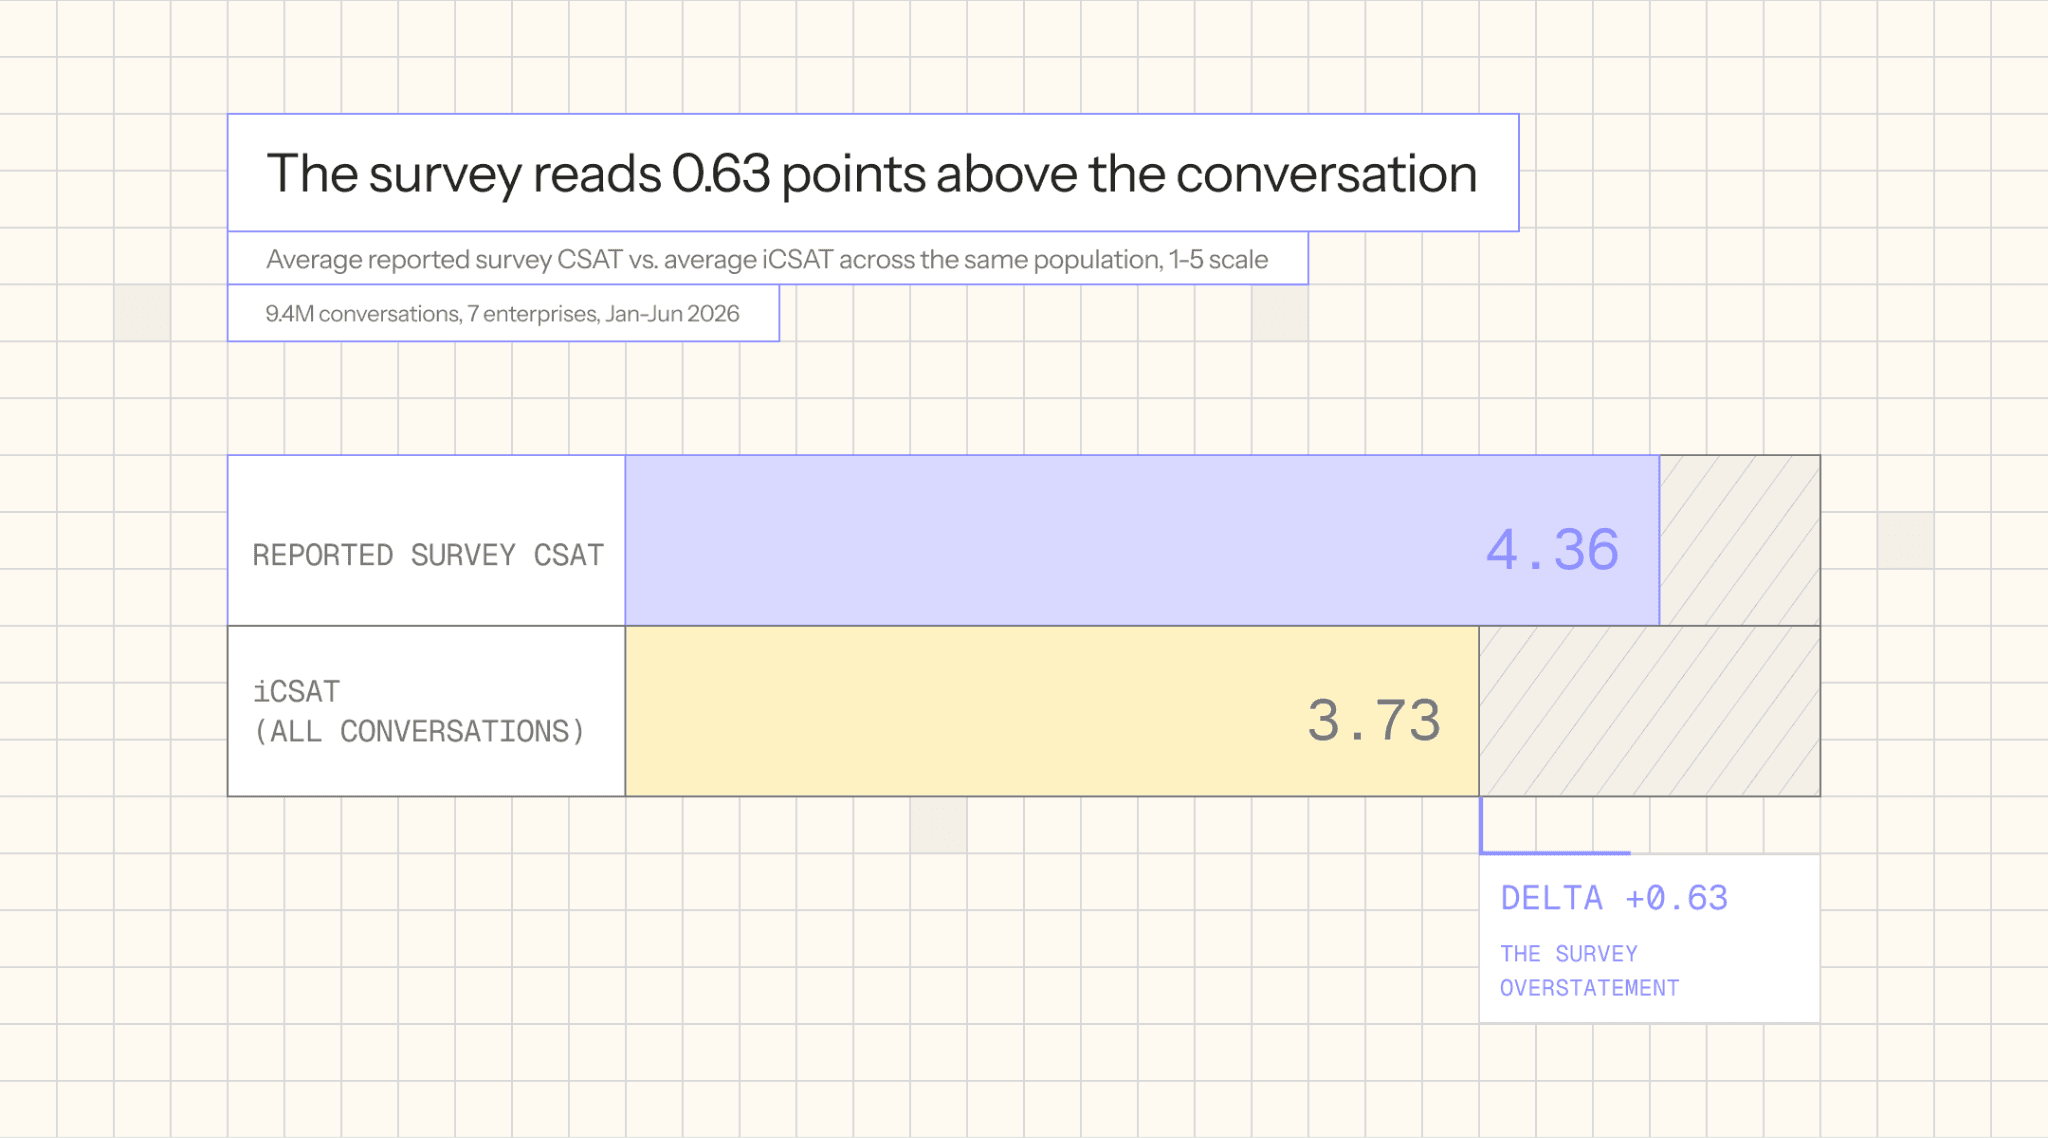
Across 9.4 million conversations on the Level AI platform from the first half of 2026, the captured CSAT scores averaged 4.36, while iCSAT, Level AI’s inferred satisfaction score computed on 100% of conversations, averaged 3.73. CSAT surveys overstate customer satisfaction by 0.63 on a 5-point scale. The rest of the report walks through what we found, why it's a design problem more than a measurement problem, and what to do about it if you don’t want to (or can’t) rip out your survey program tomorrow.
How we measure
There are two primary signals that we’re measuring:
Inferred CSAT (iCSAT) is a 1-to-5 score generated for every conversation. Level AI uses multiple AI models to read the full interaction and score it on the same scale a post-contact survey would use, based on signals the customer expresses inside the conversation. These include multi-emotion sentiment trajectory, resolution language, effort markers, escalation patterns, and stated frustration or satisfaction. iCSAT covers 100% of conversations, while post-contact surveys were filled in for only 4.2% of contacts in this cohort.
Survey CSAT is the score customers submit through each enterprise's post-contact survey program, standardized to a 1-5 scale for this analysis. Note: The Level AI platform does not run surveys, but we are able to capture connected survey data.
The two instruments correlate at 0.39 (Pearson) with a mean absolute error of 1.07 points. The gap between them is what the rest of this report takes apart, starting with the first of the three mechanisms: what responders say.
The distortion concentrates at the low end
The biggest effect we noticed, comparing survey scores against iCSAT for the same conversations, the gap tracks the satisfaction level itself. At the top of the scale, the survey matches the conversation. As satisfaction drops, the gap widens:
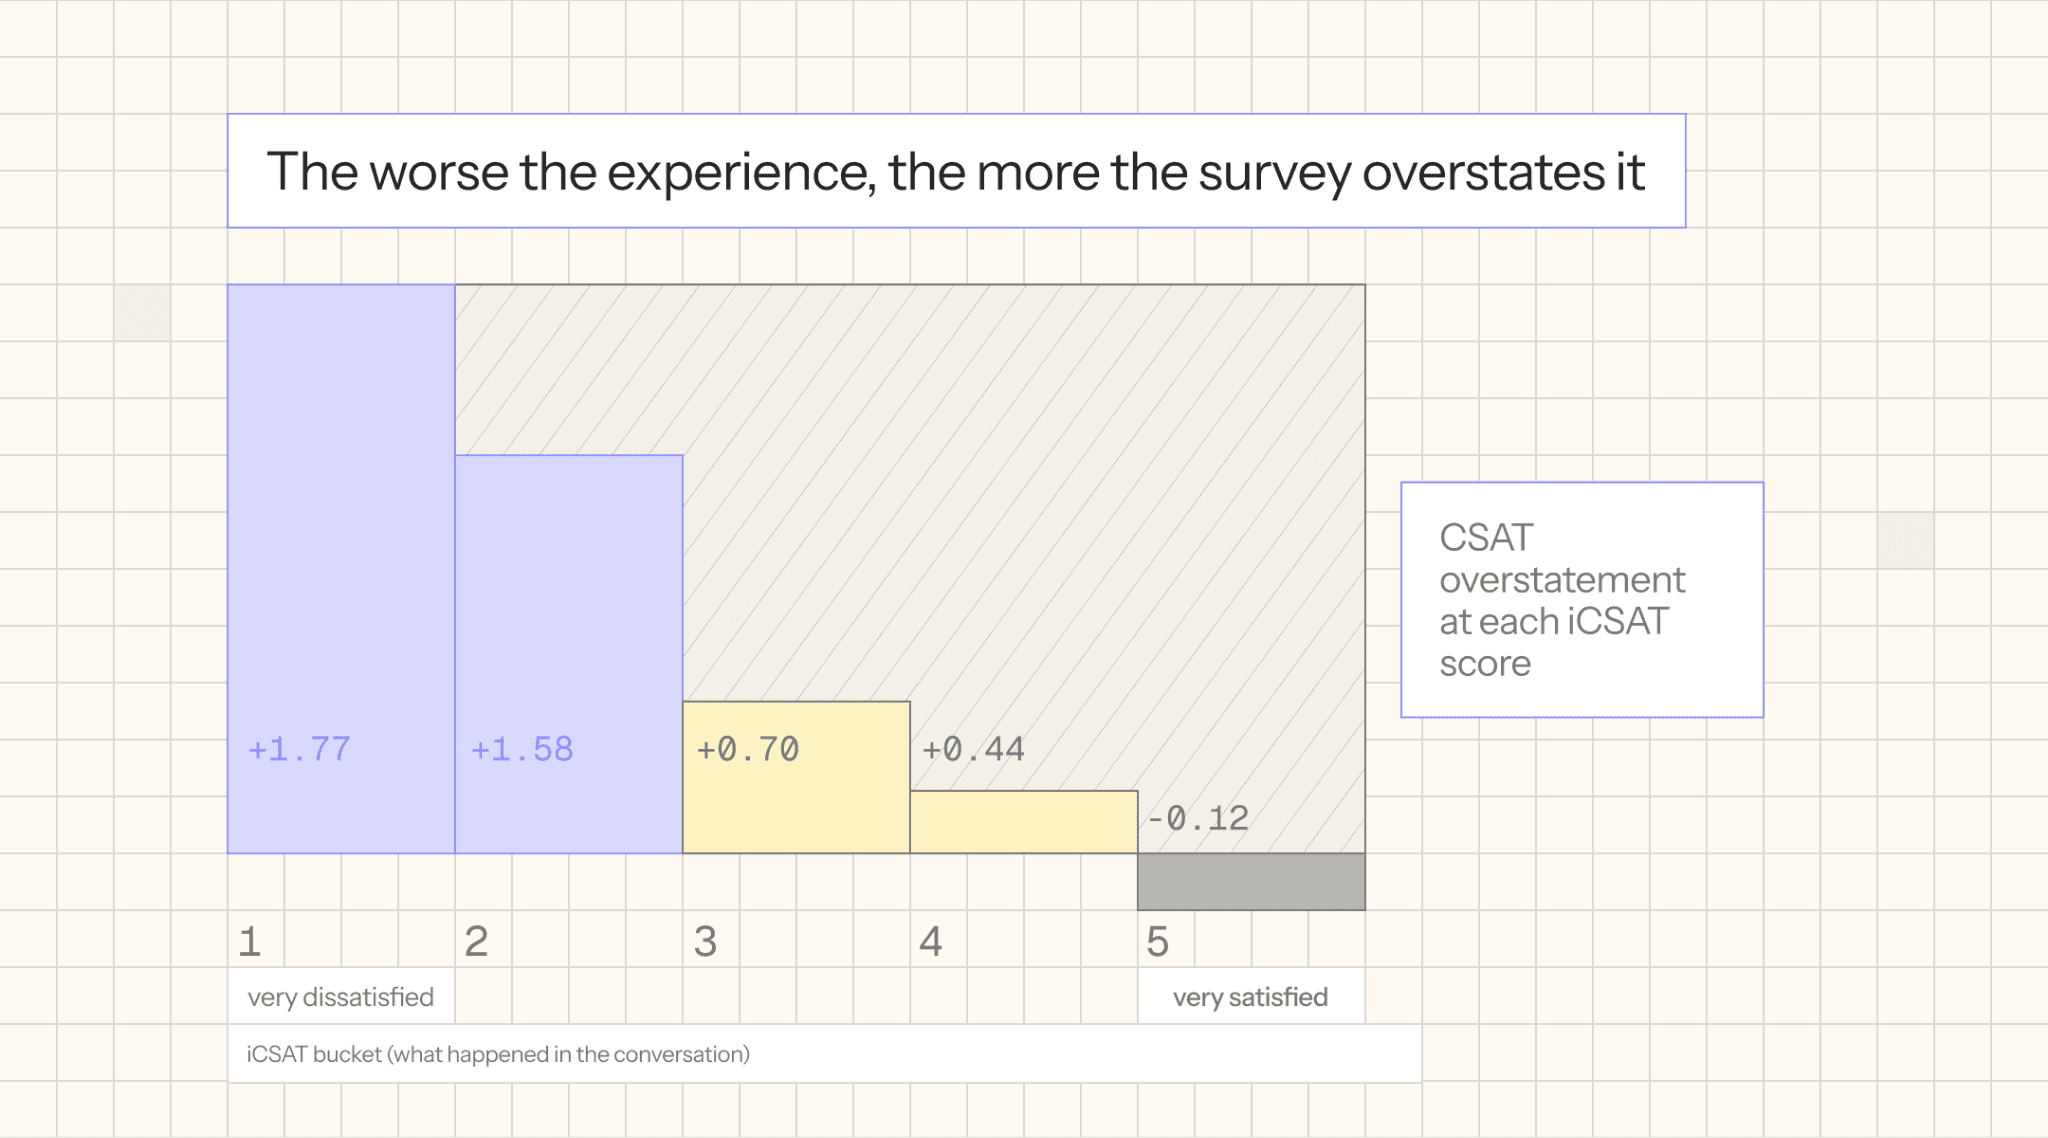
For conversations identified with an iCSAT of 1, the customers actually responded with a 1.77 point higher rating when asked about their experience. Furthermore, when we slice the data by resolution outcome, survey scores skew more positive in every resolution bucket, with a widening gap as resolution status weakens
Resolution status | Conversations | Survey rate | Avg iCSAT | Avg survey score | Gap |
Unresolved | 2,000,044 | 3.22% | 1.95 | 3.52 | +1.57 |
Partially Resolved | 3,018,055 | 3.58% | 3.42 | 4.02 | +0.60 |
Resolved | 4,525,193 | 4.97% | 4.74 | 4.77 | +0.03 |
These two drivers compound: Resolved customers submit surveys 1.5x more often than unresolved customers, and the unresolved customers who do submit a survey rate 1.57 points above their true iCSAT. This leaves customers with unaddressed issues nearly invisible in survey data. The few who do respond likely represent the cases where the customer accepted an unresolved issue: a promise of resolution, a scheduled follow-up, a credible explanation of why the issue can't be solved. That closure lets the customer rate the interaction positively even when the underlying issue remains unresolved.
This delta between survey-measured CSAT and inferred iCSAT as well as the widening negative correlation with resolution status measures the customers who responded. The scores they gave were inflated. But that is only the visible half of the problem, because a deeper question sits underneath: who responds in the first place?
Happier customers self-select into the survey
The answer: not a random sample. The customers who fill out a survey are the customers whose conversation went better.
We took a look at 7 of our enterprise customers and compared their iCSAT for survey responders against iCSAT for non-responders, using the same score, the same model, and the same conversations.
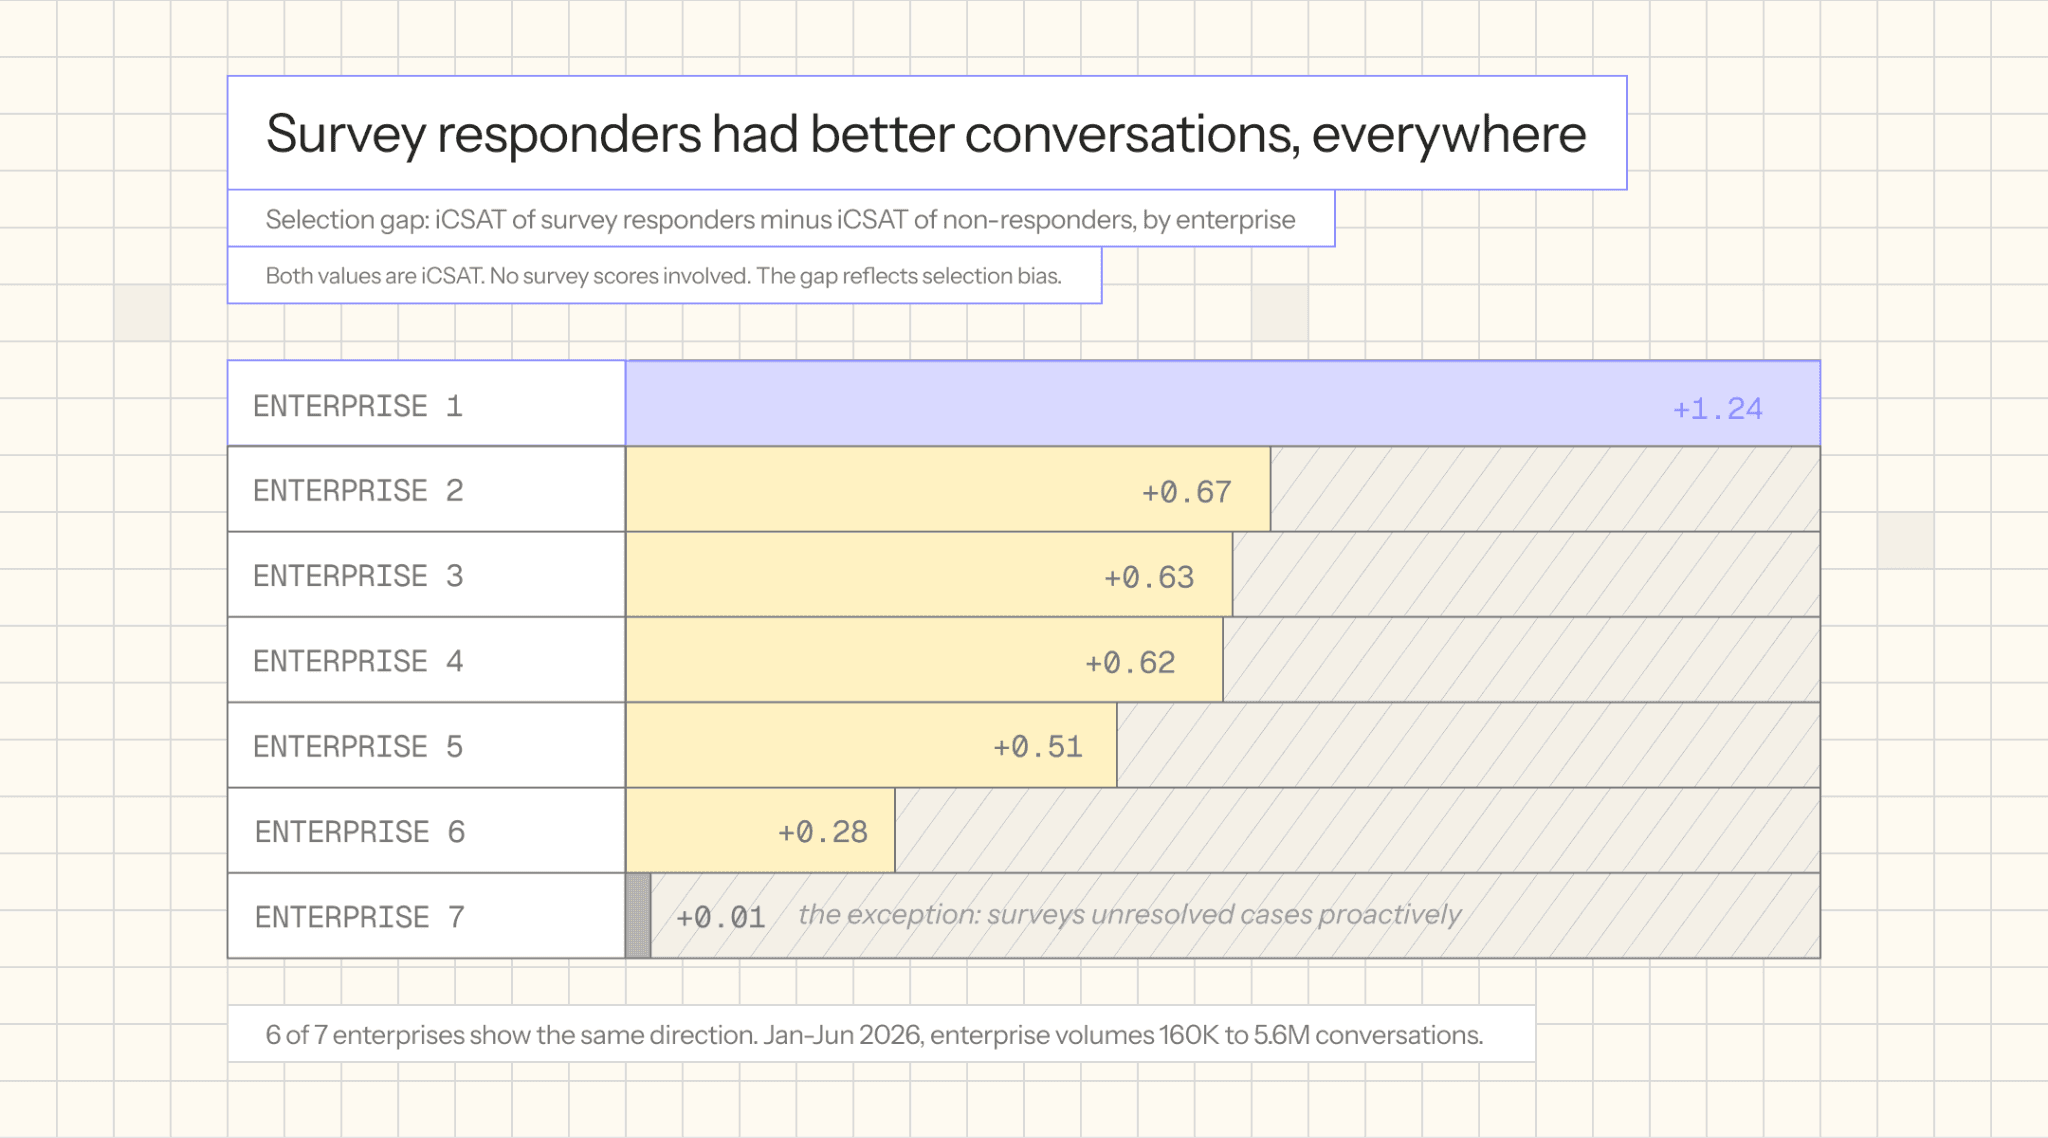
In 6 of 7 enterprises, the customers who filled out the survey had materially better conversations than the customers who didn't. Note: both columns show iCSAT; this doesn’t look at their actual survey scores. There’s a clear gap in happier customers self-selecting into the survey pool.
Selection bias hides the unhappy. But plotting response rates across the full satisfaction range reveals that the unhappy are not the only ones going unheard.
Your average customer is underrepresented in surveys
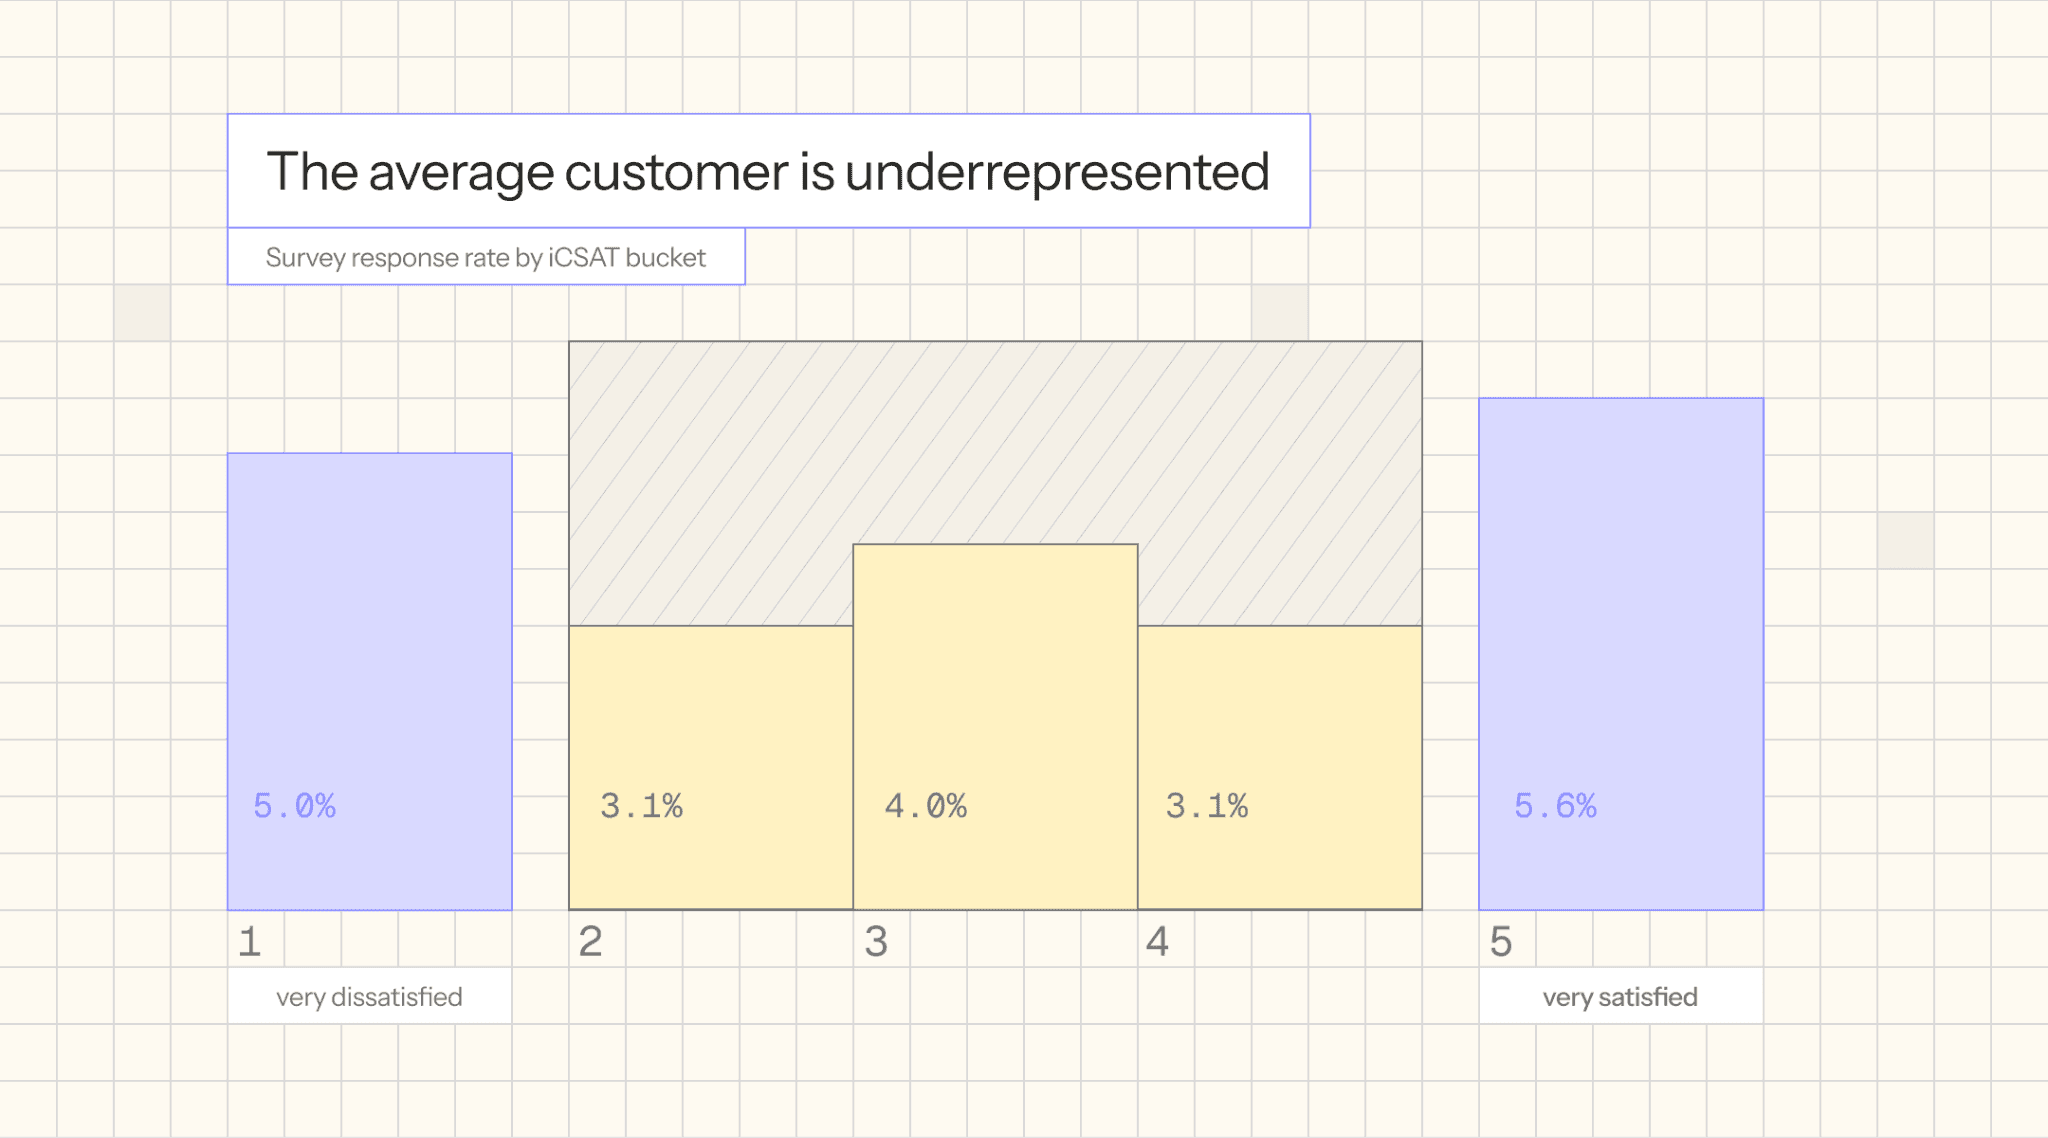
When you map survey response rates against iCSAT score, we get a U-shaped curve, where the extremes are more likely to complete a survey.
iCSAT bucket | Conversations | Survey responses | Response rate | Avg survey score | Overstatement |
1 (Very dissatisfied) | 119,929 | 6,062 | 5.05% | 2.77 | +1.77 |
2 (Dissatisfied) | 1,944,851 | 60,934 | 3.13% | 3.58 | +1.58 |
3 (Neutral) | 1,778,248 | 71,464 | 4.02% | 3.70 | +0.70 |
4 (Satisfied) | 2,523,631 | 79,471 | 3.15% | 4.44 | +0.44 |
5 (Very satisfied) | 3,424,993 | 191,580 | 5.59% | 4.88 | -0.12 |
Critically, those in the middle, iCSAT 2- 4, account for 6.2 million conversations, roughly two-thirds of the entire cohort, but only contribute to about half of the total survey responses.
Missing the middle costs the business in both directions. Without visibility into the drifters, teams cannot intervene before a churn decision hardens, so retention work becomes reactive instead of proactive. And because the responses that do arrive skew toward the extremes, the survey paints a distorted picture of a customer base split between 5s and 1s, pushing teams to firefight the loudest detractors while the persuadable middle slips away unattended.
When a KPI becomes a target, it loses relevance as a measure
CSAT is an incentivized metric. Agents are measured on it. Team leads are measured on it. Contact center executives report it to the business. When a metric is incentivized, the system optimizes for the metric, not for what the metric was designed to represent.
Those of us who’ve been in this space long enough are familiar with these tactics. Survey triggers are optimized for positive resolutions events, and agents pay close attention to customers they want to encourage post-call surveys with
How and when surveys are sent ends up mattering more than actual customer satisfaction. That is the direct consequence of measuring people on a metric that they can influence upstream of the customer's honest answer.
Some other interesting findings that illustrate just how nuanced and layered this dynamic is: As customers become repeat callers, their satisfaction is less represented.13.26% response rate from a single contact vs. 10.97% response rate on the second contact. This drops further, a few percentage points, with each additional touch.
On a sample of 13,908 repeat customers matched against 65,802 single-contact customers,
The survey-vs-iCSAT gap runs wider on asynchronous channels, email and chat, where more time and more handoffs create more room for the interaction to break down. From a 0.6 point gap in voice calls (synchronous communication), up to a 1.15 gap in async email support.
Some conversation topics are overrepresented in CSAT
Certain support topics are overrepresented in CSAT.At one Fortune 500 customer we analyzed, response rates varied 2x by contact reason, from 6.9% for payments to 14.2% for product quality
What to do about it
We clearly are advocates for moving your operations to iCSAT measurement, as that provides the most accurate, comprehensive, and fine-tuned view of your customer health. Regardless, you can still optimize CSAT-specific mechanisms for a more accurate representation:
Re-weight survey analysis by contact category. Response rates vary 2x across contact reasons, so raw survey averages over-count the topics that respond and under-count the topics that don't. Weight survey results by each category's share of contact volume, not its share of survey responses. Report category-level CSAT only where response volume supports it, and flag the categories where it doesn't. An unweighted headline CSAT is a topic-mix artifact, not a satisfaction reading.
Publish iCSAT alongside survey CSAT, and treat the reported number as a top-of-population reading. Survey CSAT tells you what your happiest, most-prompted, most-emotionally-invested customers think. iCSAT tells you what happened in the conversation. They're both real, they answer different questions, and the gap between them (per team, per contact reason, per channel) is itself a useful KPI. Any decision that treats reported CSAT as an average of your whole customer base (budget allocation, agent performance reviews, board reporting) is working from an inflated baseline. Naming what population the number represents is table stakes.
Run recovery on iCSAT and resolution, not on survey score. Survey-driven recovery programs miss the failures that need recovery most. iCSAT identifies unresolved, high-effort, negative-sentiment conversations regardless of whether the customer responded. Recovery programs built on that signal work from the full sample, not the sanitized one.
The takeaway
CSAT surveys are not wrong. They read the satisfied portion of the customer base well.
However, they misrepresent dissatisfied and unresolved customer segments and underrepresent the middle. The customers most likely to churn, most likely to escalate, and most likely to cost the business are the customers surveys hear from least and rate most generously when they do hear from them.
Survey CSAT is a signal about the customers who answered. iCSAT is a signal about the customers who called. Contact centers making decisions on the first without the second are measuring the wrong population.