

Qualtrics XM and SurveyMonkey are both popular options for creating, sending out, and analyzing customer surveys. Qualtrics is often the better choice for large enterprises that need specialized customizations, while SurveyMonkey is typically used by companies that want to set up simple surveys without much hassle.
But surveys have limitations:
Limited scope: Structured surveys gather feedback on your chosen topics but may not reveal what matters most to customers.
Response bias: Even with open-ended questions, customers may omit details or exaggerate, skewing feedback.
Incomplete data: Not everyone responds (unless using a paid audience), leading to gaps in insights.
To solve these problems, we built Level AI, a customer experience software, to analyze customer support and sales conversations and learn what customers are saying.
This ensures you’re gathering detailed data from all customer interactions and on everything they’re saying.
In this article, we discuss the pros and cons of both SurveyMonkey and Qualtrics, and compare them with Level AI in the following ways:
Overview of the product — who they primarily serve, what customers like or dislike about them, etc.
How it works — survey templates, customization options, etc.
What types of reporting capabilities they have — types of visualizations, options for sharing, integrations, etc.
Other features included in the platform
Pricing
Overview
SurveyMonkey: user-friendly and affordable survey software
SurveyMonkey was built to help small businesses and organizations of all sizes gather surveys at scale, and it’s still mostly centered around that service. (In a later section we’ll touch on a couple of other features that aren’t strictly survey features.)
It’s known for offering a user-friendly platform and flexible pricing. If you’re sending out surveys for the first time or only need simple survey logic, SurveyMonkey is likely a good choice.
SurveyMonkey primarily serves the healthcare, education, technology, government, and financial services industries.
Qualtrics: experience management platform for enterprises
Qualtrics is an experience management platform, which differs from a survey platform because it:
Offers more ways to collect data than just surveys (more on this later).
Differentiates between gathering data around customer vs employee vs brand experiences.
Has more options for reporting on and analyzing the data.
While SurveyMonkey keeps things simple so that anyone can easily use the platform, Qualtrics focuses more on offering advanced customization options. Because of this, many users find that Qualtrics has a steeper learning curve than SurveyMonkey.
However, Qualtrics offers extensive tutorials and product documentation to help users overcome the learning curve.
Because it’s more comprehensive and geared towards research needs, many large companies and research organizations find Qualtrics the better choice.
Qualtrics serves most industries including automotive, education, healthcare, government, and more.
Level AI: customer experience intelligence and automation
Unlike SurveyMonkey and Qualtrics, Level AI isn’t a solution for creating surveys.
Instead, the platform automatically captures data from 100% of customer conversations, including full details across all communication channels.
This allows you to uncover hidden trends, emerging issues, and the root causes of customer satisfaction automatically and in real time. In the next section, we’ll share more details about the inner workings of how Level AI helps you do that.
Level AI is used by companies of all sizes in healthcare, financial services, insurance, collections, retail and more.
For example, our secure and customizable Generative AI capabilities helped a contact center save $3 million and 40 seconds in average handling time.
How it works: survey templates, customization options & more
SurveyMonkey: extensive out-of-the-box options, limited customization
SurveyMonkey offers lots of helpful tools for building surveys including 400+ templates for NPS, event registration, customer satisfaction, employee engagement, event or meeting feedback, course evaluation, and many more.
They also offer a suite of AI tools that can generate surveys for you based on a written description, best question types based on your question, and tips on how to improve your survey draft.
If you want to create a questionnaire from scratch, you can choose from more than 25 question types, along with elements such as:
Multiple choice questions
Checkboxes
Sliders and dropboxes
Matrix and rating scales
Likert scale questions
And more…
If you’re not sure the best way to ask a question, you can visit the SurveyMonkey Question Bank, which offers thousands of pre-written questions on a variety of topics.
Then, with just a few clicks, you can add a question and apply skip logic to create a tailored survey experience.
When your survey is complete you can send it out through various channels, such as email, text, web link, or social media.
Additionally, SurveyMonkey provides tools for controlling user access and permissions and lets multiple users work on surveys simultaneously.
While SurveyMonkey offers lots of options out-of-the-box, it does have limitations when it comes to more complex survey setups. For example, its skip logic can only be used on closed-ended questions and their branching logic struggles to accommodate multiple conditions.
Qualtrics: tools for data analysis and qualitative research
While SurveyMonkey focuses on simplicity and ease of use with pre-built tools and templates, Qualtrics offers advanced features for data collection, market research, and experimental design.
Qualtrics’ data collection features and experimental designs allow you to create highly customized questionnaires that include:
Matrix tables and ranking questions for collecting multidimensional data
Loop & Merge for cycling through possible answers in multiple-choice questions
Conditional branching to carry through and change embedded data based on previous responses
Branch logic to specify intricate survey paths based on various criteria, including multiple “and/or” statements
In terms of market research you can:
Combine various qualitative research methodologies like video feedback, video diary studies, and in-depth interviews alongside quantitative research
Analyze qualitative data using AI and analysis tools to identify key patterns and themes
Use pre-built, expert-designed research projects designed by XM professionals
Access research panels of up to 35 million preselected respondents
The platform’s ExpertReview uses AI to analyze surveys as they’re built and also recommends improvements.
You can also get UX feedback on your surveys using HotSpot testing, which sends an image of the survey for respondents to interact with and comment on.
Qualtrics’ features come with a learning curve though, and may not be suitable if all you want to do is send out a couple of quick surveys.
It also doesn’t have as many integrations with major providers like SurveyMonkey (the latter offers more than 200 and counting).
Level AI: automated customer feedback collection without manual setup
Our AI speech analytics uses natural language understanding (NLU) and semantic intelligence to “listen in” on conversations your customers are having with sales, support, and others, to understand what they’re saying and feeling.
This removes the need for using surveys to gather data on concerns that are top of mind for customers. Their interactions with your organization offer insights into their motivations, frustrations, and the reasons why they contacted you in the first place.
Our platform’s Scenario Engine understands not only the words people are saying, but also identifies the intent expressed in the conversation, which we refer to as a scenario.
An example of a scenario is when a customer has a question about their warranty, or wants to update their contact information, or has a complaint.
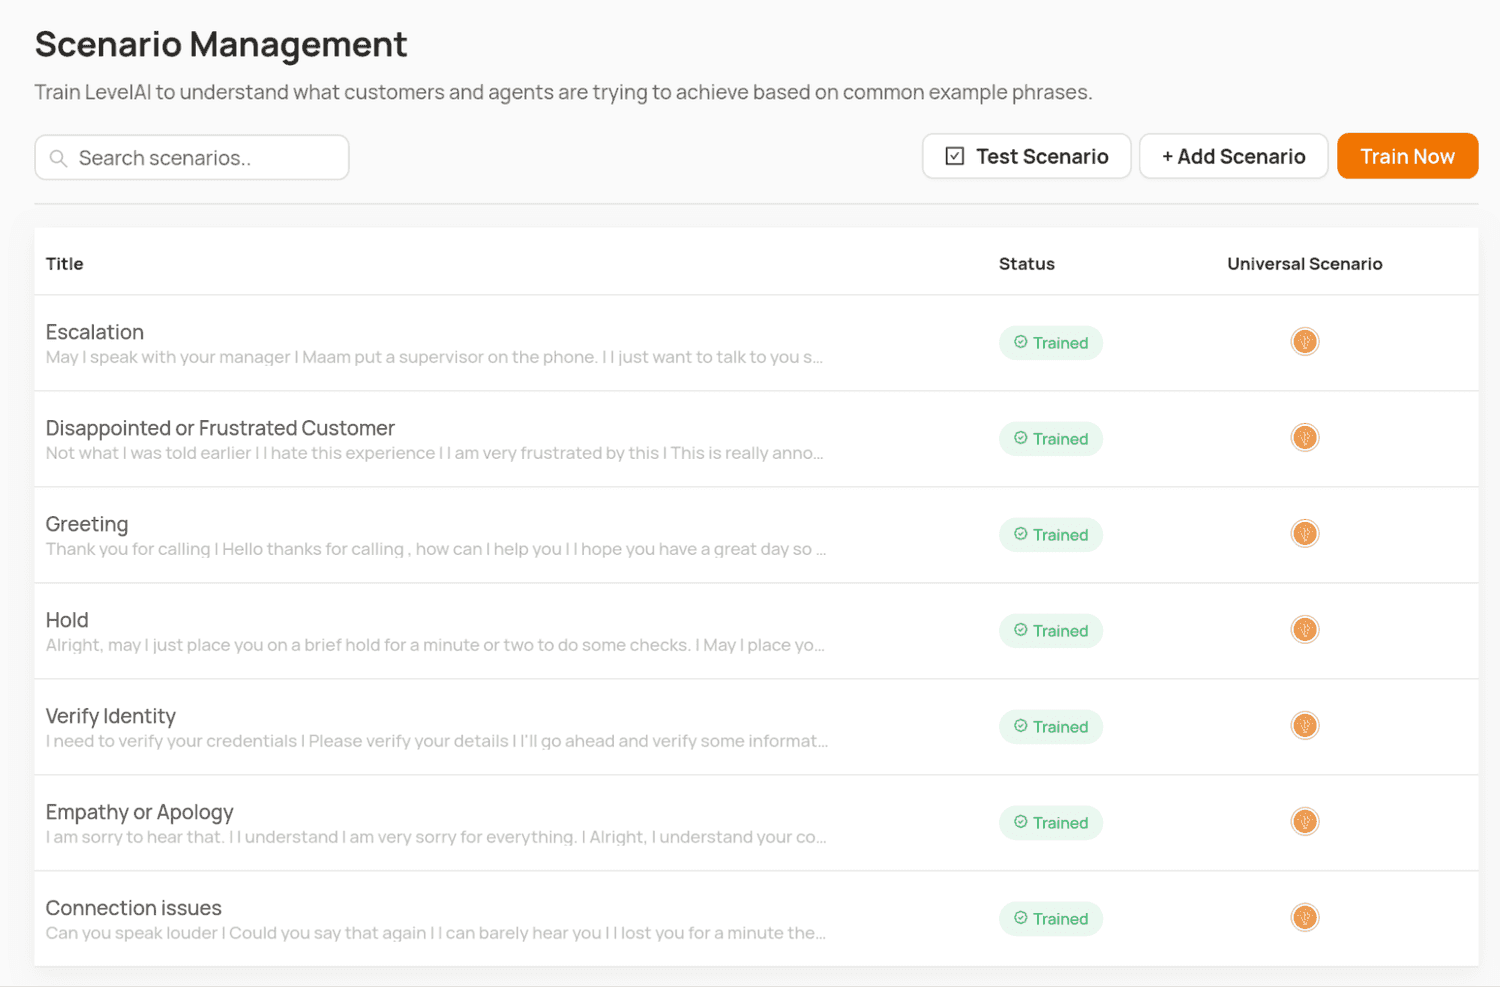
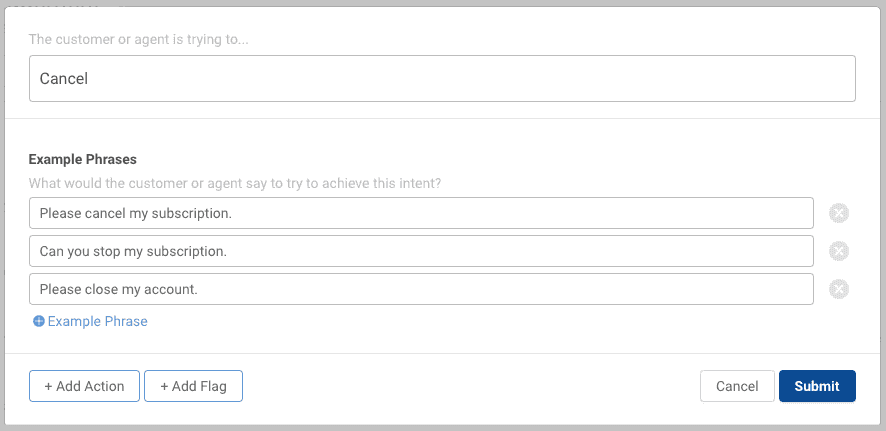
Level AI comes with a number of predefined scenarios out of the box, but you can also define your own custom scenarios according to your business needs by entering example phrases that customers might use to express the intent:
The system identifies specific scenarios in customer interactions using conversation tags, which indicate places in conversation where a particular intent was expressed.
Conversation tags are searchable and filterable, making it easy to sort through hundreds of conversations to find ones containing a particular intent.
Reporting capabilities
SurveyMonkey: making data actionable with word clouds and visualizations
Besides offering basic reporting features like visualizations of survey data and customization options like adding numbers to charts for easier reading, SurveyMonkey allows you to combine data across multiple surveys and monitor key metrics over time.
The platform also lets you monitor survey results as these roll in and share these with respondents as graphs and tailored insights.
It offers various ways to filter results so you can focus on subsets of these for your analysis. For example, you can filter responses based on:
Specific answer choices for closed-ended questions
Keywords and phrases for open-ended questions
Open-ended questions are particularly challenging to analyze due to their unstructured nature so SurveyMonkey offers tools for:
Sentiment analysis, which categorizes responses as positive, neutral, or negative
Word cloud visualizations that show which words were used most frequently in responses
Text tagging and sorting, which allows you to apply rule-based logic to help you identify and analyze calls that contain specific keywords
SurveyMonkey analyzes sentiment using a contextual sentiment model, which is based on machine learning techniques that consider the surrounding context of words and phrases to determine their emotional tone.
You can share data pages by generating unique links, allowing recipients to view survey results, and export data in common formats like PDF, XLS, or CSV — letting you incorporate these into presentations as needed.
Qualtrics: advanced analytics with detailed insights
Qualtrics allows you to prepare reports by cleaning, merging, classifying, and statistically analyzing response data.
Qualtrics ensures the accuracy and relevance of survey results by letting you:
Edit individual responses to remove foul language, correct errors, or make other changes
Combine responses from multiple surveys or import external data to create a comprehensive dataset
Adjust column layouts by selecting and organizing these to better visualize and analyze data
Filter responses based on specific questions, survey metadata, contact fields, or embedded data fields to focus on a particular, more relevant subset of data
Qualtrics additionally offers text analysis (TextiQ) that lets you assign topics to feedback you’ve received, do lemmatization, and apply spell checking to ensure accurate tagging. It also generates widgets like constellation charts.
You can do advanced statistical analysis (StatiQ) to uncover relationships, identify trends, and build predictive models by automatically running statistical tests, translating results into clear language, and presenting findings in an easy-to-understand visual format.
Qualtrics uses a language model to uncover sentiment and to offer a more granular classification than SurveyMonkey’s, classifying emotions into six categories:
Very Positive
Positive
Neutral
Negative
Very Negative
Mixed
The platform assigns a numeric score of -2 to +2 (with 0 being neutral) to the identified sentiment to reflect its intensity. For example, a respondent’s reply of “You’re the very best” would garner a +2 (very positive) sentiment score.
Qualtrics also gives you access to customizable visualizations, real-time reporting of survey responses, and the ability to export data to multiple formats.
Level AI: automatically surfacing actionable trends across interactions
Level AI’s understanding of what customers mean and their intentions in contacting you provides exceptional situational awareness in areas where your products, services, or processes might be failing to meet expectations.
Unlike rule-based software that can only match certain patterns set by predefined keywords, our platform analyzes unstructured conversations to gather data. In order to truly understand what customers are saying and feeling requires an understanding of natural language, which generative AI offers.
For example, a keyword-based system might recognize when a customer wants to return a product when it identifies words like “return” or “send it back.”
Capturing all possible expressions of such an intent would require you to enter tens or perhaps hundreds of keywords to ensure all possible variations of someone expressing a desire to return a product are captured.
And keyword-based detection might miss the greater context of a discussion, like why a customer wants to return an item: was it because the dress didn’t fit, or the fabric was uncomfortable?
This lack of context means the system might fail to distinguish between a customer expressing personal dissatisfaction with the product versus simply needing a different size, hampering a company’s ability to understand and respond effectively to customers.
Uncovering customer feelings
Level AI’s deep understanding of natural language underpins its call center sentiment analysis.
Unlike platforms that focus only on emotional intensity — for example, classifying these as positive, negative, or neutral — Level AI identifies a wider range of emotions, the most of any software in our category:
Gratitude
Happiness
Admiration
Worry
Disapproval
Disappointment
Anger
The software denotes instances of expressed sentiments using sentiment tags. As with conversation tags, these allow you to search through thousands of conversations to identify those where a particular sentiment was detected.
Level AI also scores the overall “emotional temperature” of a conversation with a Sentiment Score, which is a weighted calculation (on a scale from 0 to 10, with 0 being the most negative and 10 being most positive) of all sentiments expressed during the interaction.
Examples of ways that Sentiment Score helps you include:
Uncovering hidden frustration or annoyance; for example, a customer might give a decent CSAT score on a survey but their corresponding Sentiment Score for the conversation might be low.
Identifying agents who excel at turning negative situations around.
Pinpointing areas where you need to improve processes or provide better agent training, such as frustration around long wait times or product issues.
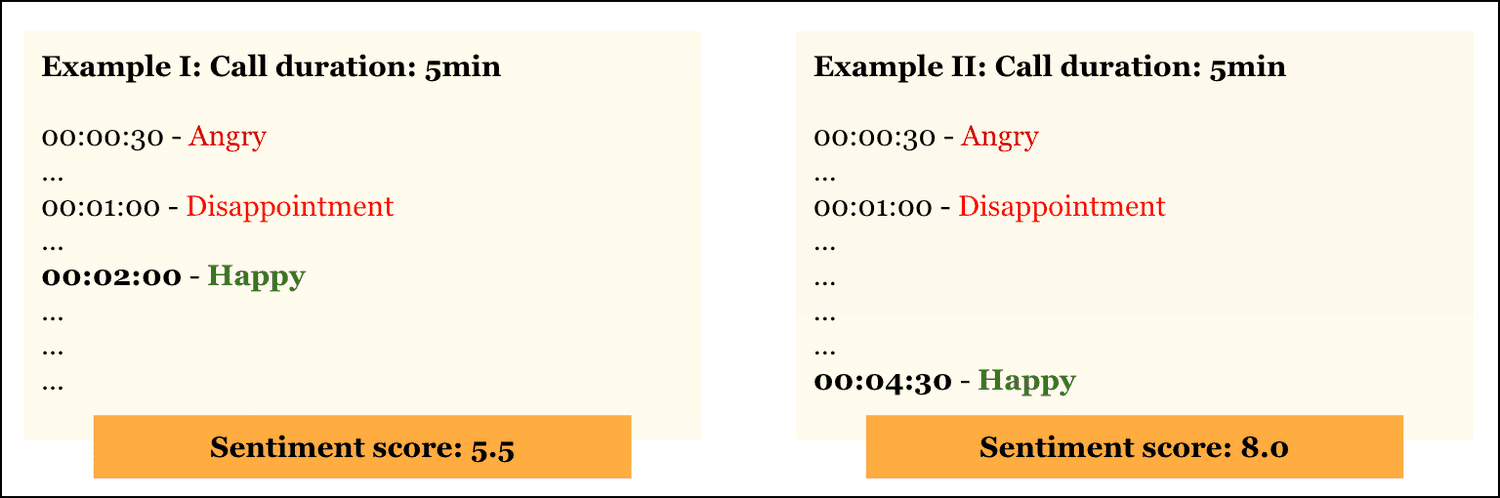
The Sentiment Score of the conversation is calculated by identifying each emotion expressed by the customer throughout the conversation and assigning each occurrence a separate weight.
For example, let’s say a customer calls in angry at the beginning of a conversation but, after the issue resolution, expresses satisfaction. Emotions occurring towards the end of a conversation are weighted more heavily than those at the beginning to reflect the more lasting impression about a brand, product, or service that a resolution (or lack of a resolution) may leave:
Seeing the bigger picture from your customer data
Level AI’s Voice of the Customer Insights automatically derives standard VoC metrics like CSAT, NPS, and CES from interactions of customers with your organization.
Such metrics and trends are automatically distilled from your customer data and doesn’t require more than clicking on the report.
As mentioned earlier, extracting key metrics from customer interaction analytics has the advantage of capturing what customers are actually experiencing in the moment, without the biases or limitations of surveys.
Nonetheless you may also want responses to targeted questions, and Level AI integrates with platforms like SurveyMonkey for its VoC and reporting. (Our platform also integrates with all major providers in the contact center space.)
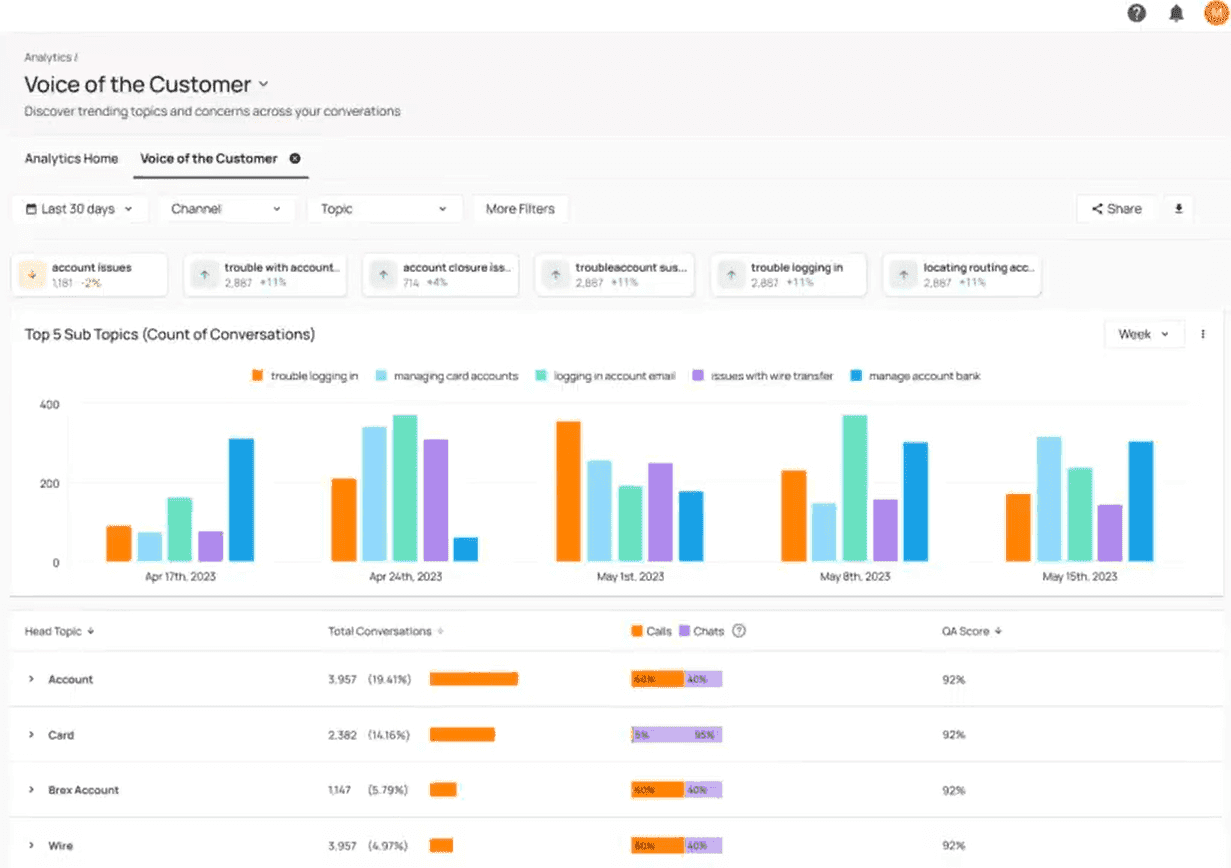
Besides standard VoC metrics, the platform also displays more subtle trends in what customers are saying. Some of these may not be immediately apparent, such as confusion over the pricing of a certain product, or specific opportunities for cross-selling by agents.
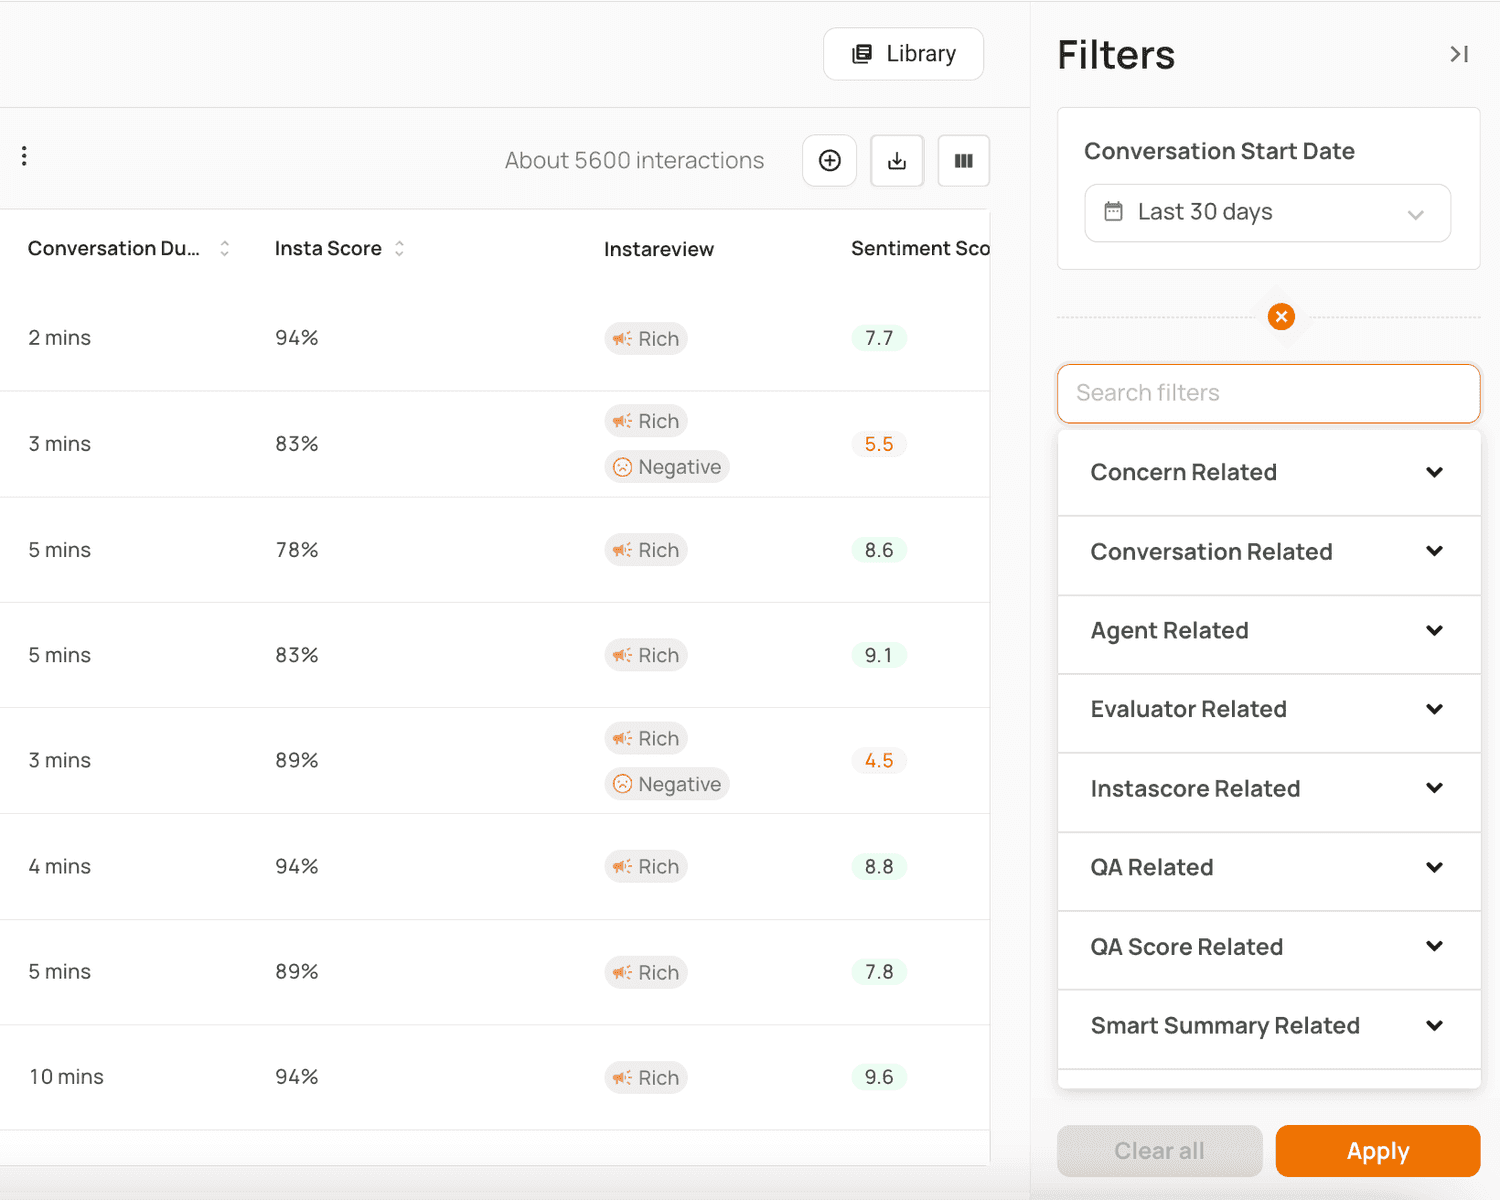
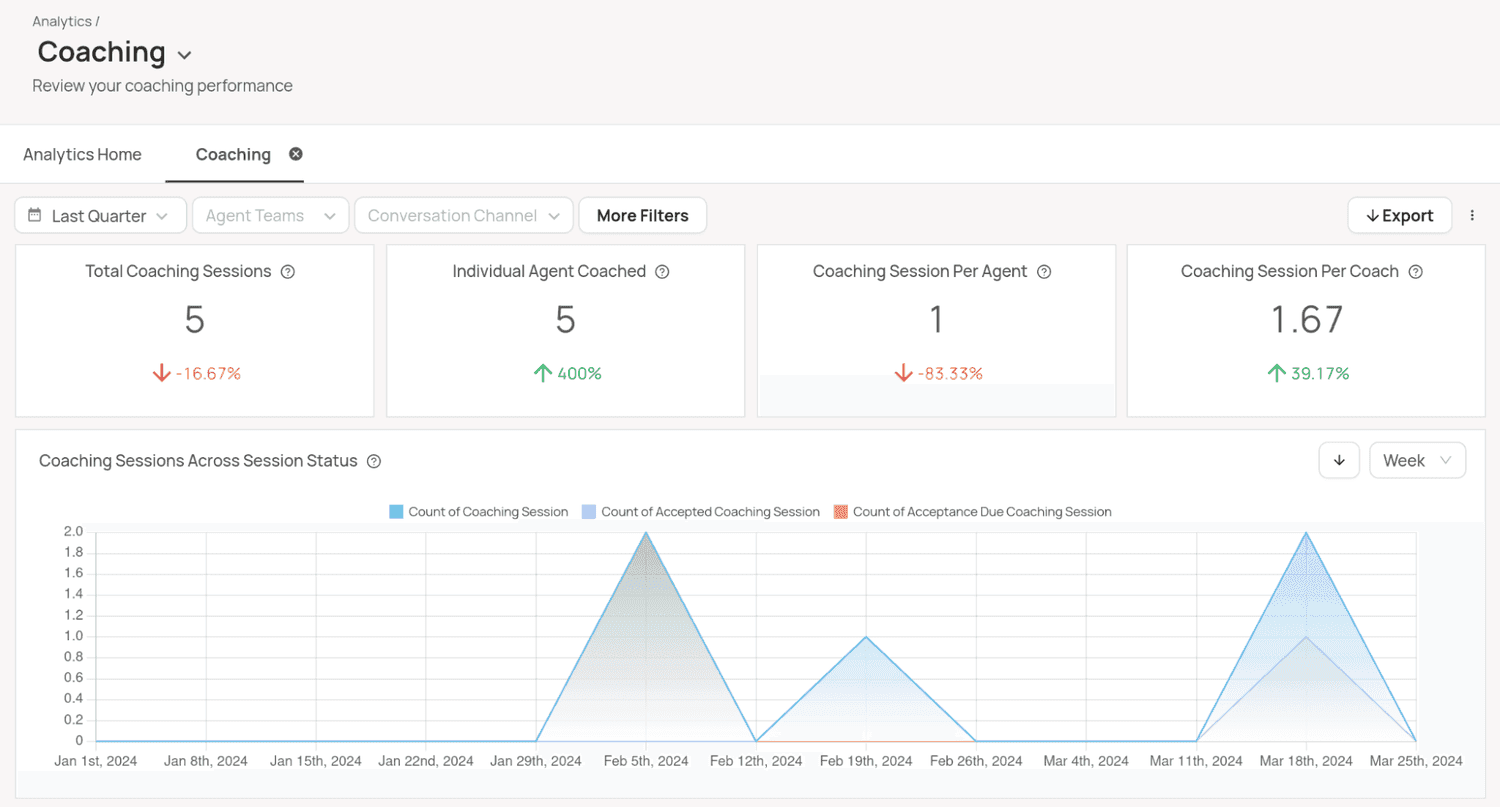
Our system displays such patterns and opportunities in intuitive dashboards that are highly customizable and can be shared with others:
Simplifying insights through advanced analytics
Reporting is most effective when you’re able to extract insights from all your data, not just a small sample of interactions.
Level AI’s business analytics and reporting offers a flexible API allowing you to pull in data from disparate sources outside our platform, such as your survey tools, CRM, ticketing system, and more.
You can combine this data with Level AI’s own conversational intelligence such as sentiment tags, VoC trends, and others, to query your data in interesting ways, such as:
What are the most common call drivers that lead to repeat customer contacts, and how does this correlate with first call resolution (FCR) rates?
Which sentiment tags (e.g., “worry,” “anger,” “happiness”) are linked to the highest or lowest post-call survey scores, such as NPS or CSAT, from your survey tool?
What proportion of customer inquiries about billing discrepancies result in refunds, and how does this impact churn rates tracked in your CRM?
How do specific agent behaviors (e.g., empathy, active listening) identified in conversations correlate with higher upsell success rates from sales data?
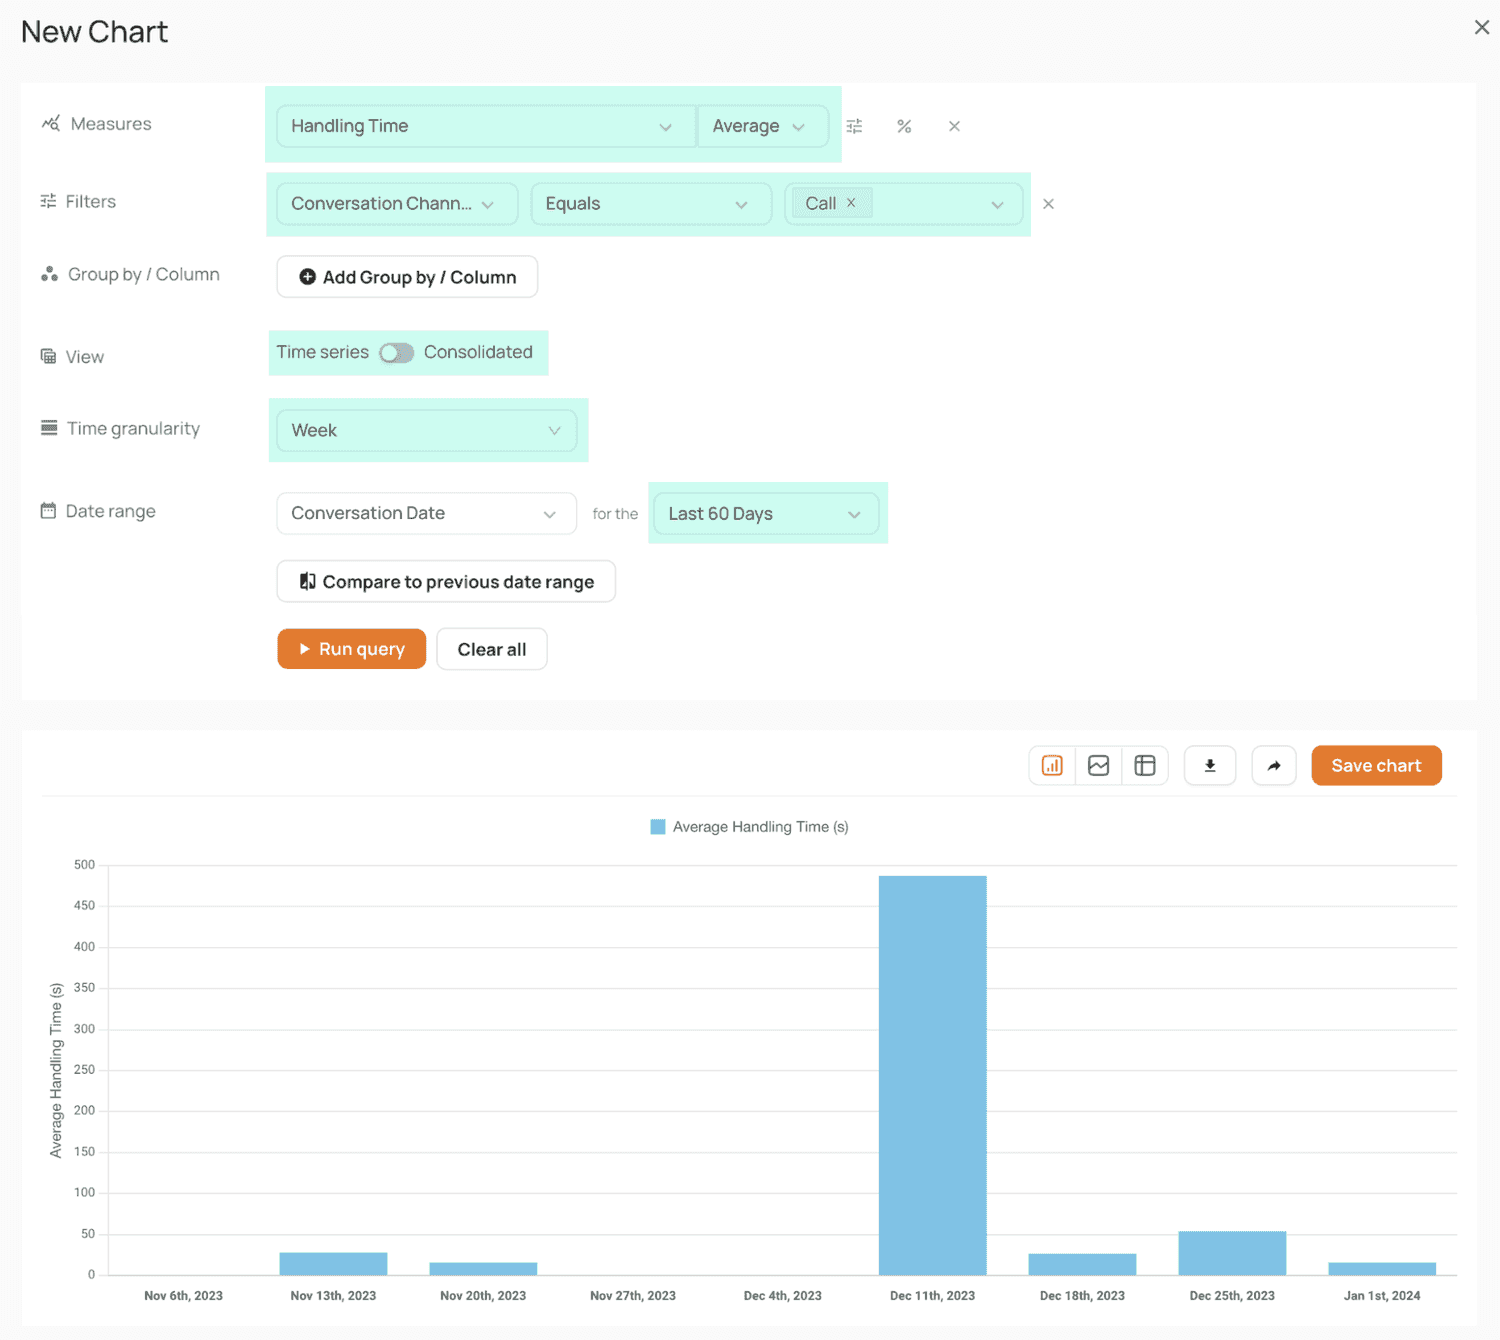
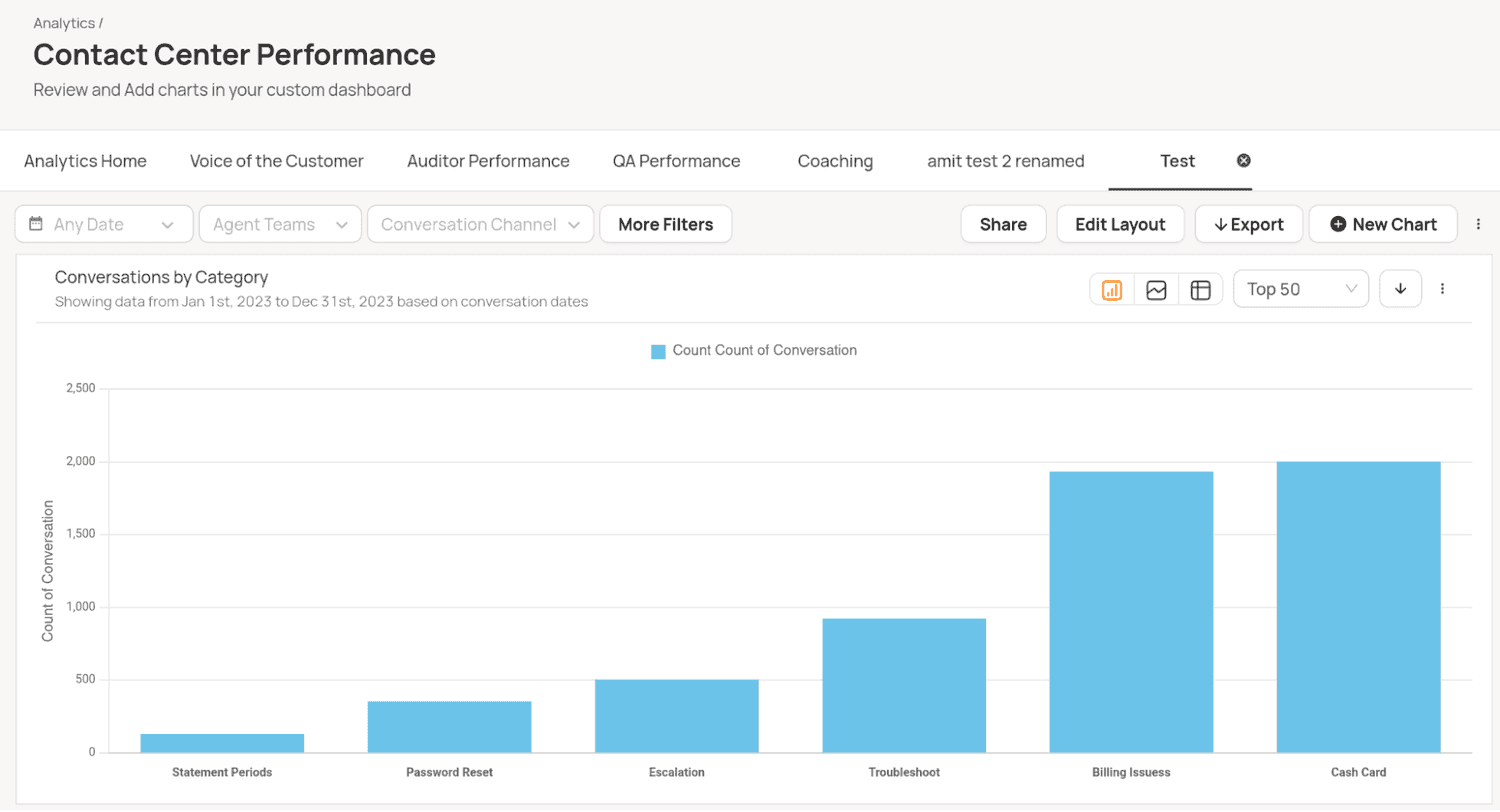
Our platform’s Query Builder provides a flexible interface letting you create tailored reports and charts that integrate data from across multiple sources:
Other features included
While both SurveyMonkey and Qualtrics are known for their survey design, distribution, and data collection capabilities, their feature sets extend beyond these core functionalities.
To help you make a more informed choice, this section highlights additional features offered by each platform that can improve your workflow or provide deeper insights into your data.
SurveyMonkey
SurveyMonkey Forms offers a nice user experience, making available more than 50 different online form designs for use cases like event registrations and applications. The platform makes these forms easy to create, providing a drag-and-drop form builder with pre-formatted fields and the ability to embed forms directly on websites.
You can also collect payments via PayPal and Stripe integrations that allow you to gather fees for registrations, applications, or donations while keeping the process simple for respondents.
SurveyMonkey also makes a global, paid audience available in order to ensure respondent data at scale. This audience (or research panel) totals more than 335 million people in over 130 countries, and the platform allows you to specify targeted subsets of these users (e.g., demographics) for niche insights.
Qualtrics
For market research, Qualtrics lets you purchase access to ready-made or custom participant lists, which can speed up the entire process.
The platform also offers various ways of optimizing survey results, from a calculator that helps you to achieve the right sample size (for what you want to do) to a panel management program that helps create and manage panels of respondents.
Qualtrics also offers R&D features for concept testing, or evaluating the strengths and weaknesses of potential products or services.
Basically, it allows you to test product concepts early on in order to better prioritize your R&D efforts towards the most promising ideas and initiatives.
You can also track changes in perceptions and awareness of your brand over time, including real-time statistics regarding your brand’s position in the market and how effective your marketing efforts are. This allows you to better formulate a brand strategy to respond to changing consumer needs.
Level AI
Level AI offers a number of other features, besides its VoC Insights and analytics, that allow you to work more efficiently.
We’ll describe a few of these here, but see our customer experience analytics solutions for more information.
Features for post-call QA
Our platform helps speed up post-call tasks by taking the time and effort of dispositioning calls away from agents, by automatically categorizing them. The AI can consistently and accurately assign a category and subcategory to a call, unlike a human agent who might be tired or mistakenly assign the wrong category.
This provides QA teams with reliable data for analyzing trends, identifying recurring issues, and prioritizing areas for improvement.
To help you implement call center quality assurance best practices and more effectively sample calls for follow-up or coaching, Level AI flags conversations having certain positive, rich, or negative characteristics.
Our InstaReview feature allows you to focus on the most impactful interactions for coaching, process improvement, or recognition.
InstaReview tags appear for conversations where the AI detects, for example, an:
Agent has requested a higher number of assists
Overall positive conversation (Sentiment Score higher than 6)
Overall negative conversation (Sentiment score lower than 6)
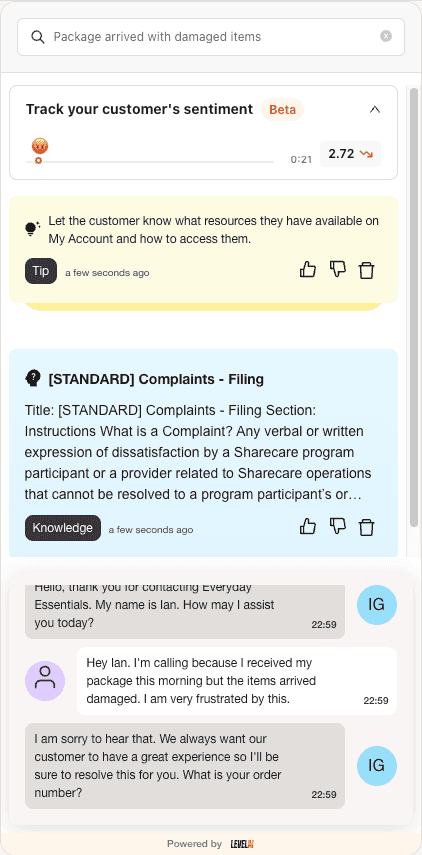
Real-Time Agent Assist detects the current topic of conversation during a live call and displays relevant FAQs, suggestions, and recommended responses to save agents the effort of manually searching for such topics.
It also minimizes the amount of time agents need to put customers on hold, as it instantly surfaces the most relevant information, knowledge base articles, or next steps in real-time.
Such information is pulled from your knowledge base, ensuring agents have immediate access to accurate and contextually relevant information.
Features for managers
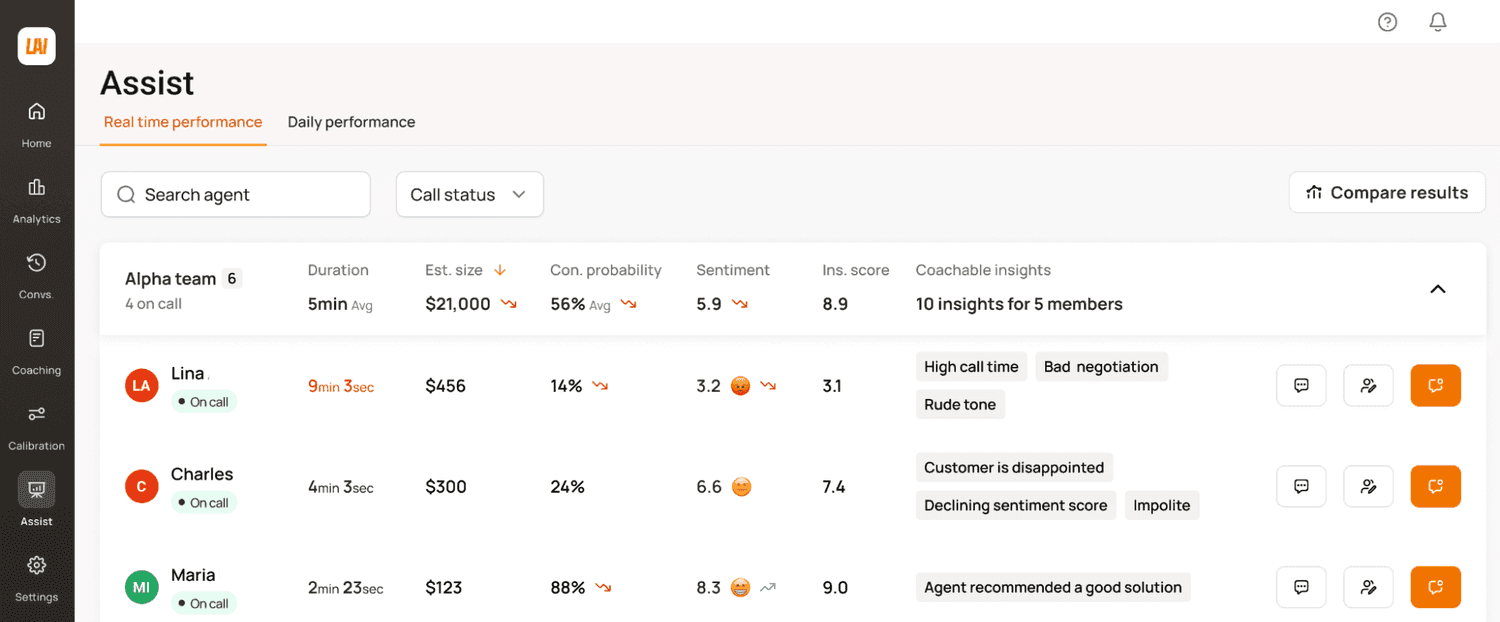
For supervisors, the platform offers Real-Time Manager Assist, a live dashboard allowing them to monitor key indicators for ongoing calls.
The feature-rich dashboard gives them situational awareness for allowing them to decide whether to intervene (either through call whispering or by requesting the agent escalate the call to them).
The dashboard provides information on each call such as:
Agent name
Call duration
Conversion probability and deal size
Agent performance
Overall live Sentiment Score of the conversation
SurveyMonkey
SurveyMonkey offers separate pricing for individuals, teams, and for enterprises.
Individuals can opt for one of three plans:
The standard monthly plan offers unlimited surveys and questions for 1,000 responses per month, for around $100 per month.
The advantage plan includes all standard features plus advanced data exports, A/B testing, and 15,000 responses per year for around $40 per month (if you sign up for a year).
The premier plan includes all advantage features with additional multilingual surveys, sentiment analysis, and 40,000 responses per year for around $140 per month (if you sign up for a year).
Teams can choose:
The advantage plan offers survey sharing, collaboration features, and 50,000 responses per year, for around $30 per user per month (billed annually).
The premier plan includes advantage features plus multilingual surveys, sentiment analysis, and 100,000 responses per year, for around $100 per user per month (billed annually).
The enterprise plan provides all premier features with additional admin controls, improved security, and unlimited API access (you must contact them for pricing).
Qualtrics
Qualtrics doesn’t disclose their pricing for their XM for Customer Experience suite. But, they allow you to purchase in three tiers:
Frontline Digital for digital interactions including survey responses.
Frontline Care for customer support interactions, survey responses, call records, chat conversations, and emails.
Frontline Locations, which include survey responses and online reviews.
You would need to get in contact with their sales team for pricing information.
Both SurveyMonkey and Qualtrics offer a free version of their software to try out.
Level AI
With Level AI, you’ll have access to all of our features and dedicated ongoing support. Plus, we’ll handle all of the setup during onboarding.
Reach out to learn more about how our platform reveals your customers’ perceptions and feelings towards your brand, and how it automates quality assurance with AI tools for customer service.

